System architecture
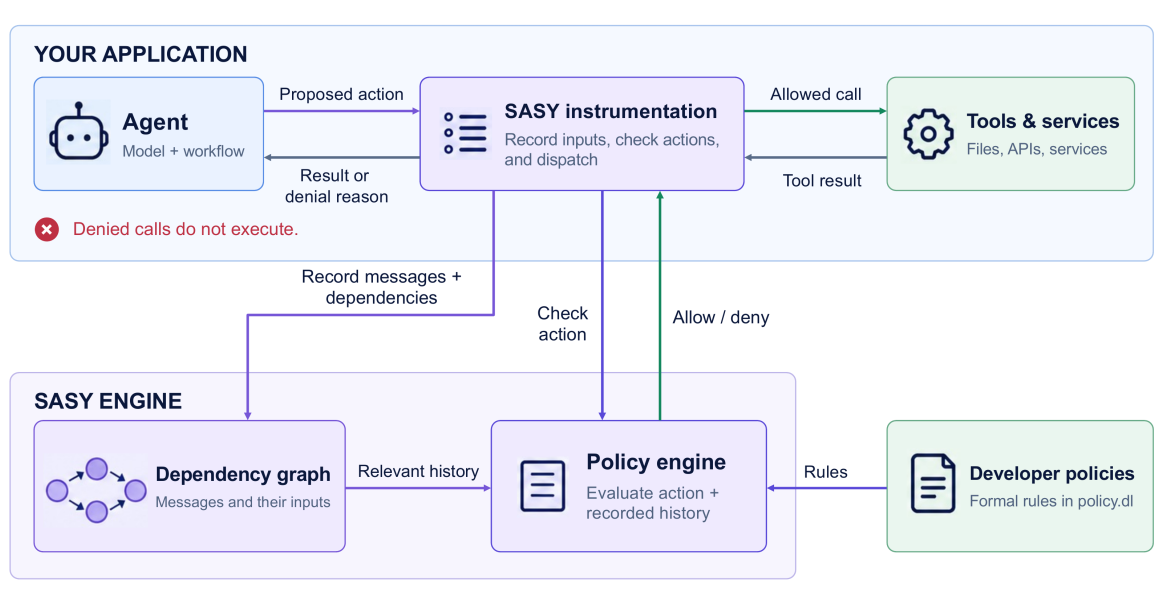
SASY runs alongside your agent. A framework adapter connects the agent to SASY: it records the inputs behind each message and checks actions before their tool handlers run. The engine evaluates your policy outside the model.
Record the inputs
Section titled “Record the inputs”The adapter records messages, tool results, and agent handoffs, together with edges to the messages each computation used. The observability service stores these records in the dependency graph. The policy engine maintains a view of that graph so it can follow an action’s inputs through earlier events.
Check before execution
Section titled “Check before execution”Before dispatching a tool, the adapter sends its name, arguments, and input message IDs to the reference monitor. The monitor asks the policy engine to evaluate the action against your Datalog rules and the relevant graph facts. An allow rule must match; a deny rule takes precedence.
The decision returns to the adapter. If allowed, the adapter runs the tool and records its result. If denied, it skips the tool and returns the reason to the agent, which can choose another action.
Where the pieces run
Section titled “Where the pieces run”The adapter runs in your application. The observability service, graph store,
reference monitor, and policy engine ship together in sasy serve.
The SDK connects your application to that process over authenticated gRPC. Start
it locally or connect to your deployed engine.
The diagram shows framework tool calls. For HTTP forwarding, the reference monitor can also check and forward a request itself. See add a framework for the recording and dispatch contract, and the security model for the trust assumptions.
To see an actual policy decision unfold, explore the animated dependency graph.